On Wednesday, the US dollar index dropped to a two-week low, briefly lifting gold prices to $2,658. However, after the PCE data showed inflation progress stagnating, signaling that the Federal Reserve may adopt a more cautious stance on further rate cuts, gold’s gains narrowed, closing at $2,635.79 per ounce.
Meanwhile, oil futures ended the day slightly lower as the market evaluated the impact of the Israel-Lebanon ceasefire, lower-than-expected crude inventory increases, and the upcoming OPEC+ meeting this Sunday.
Gold
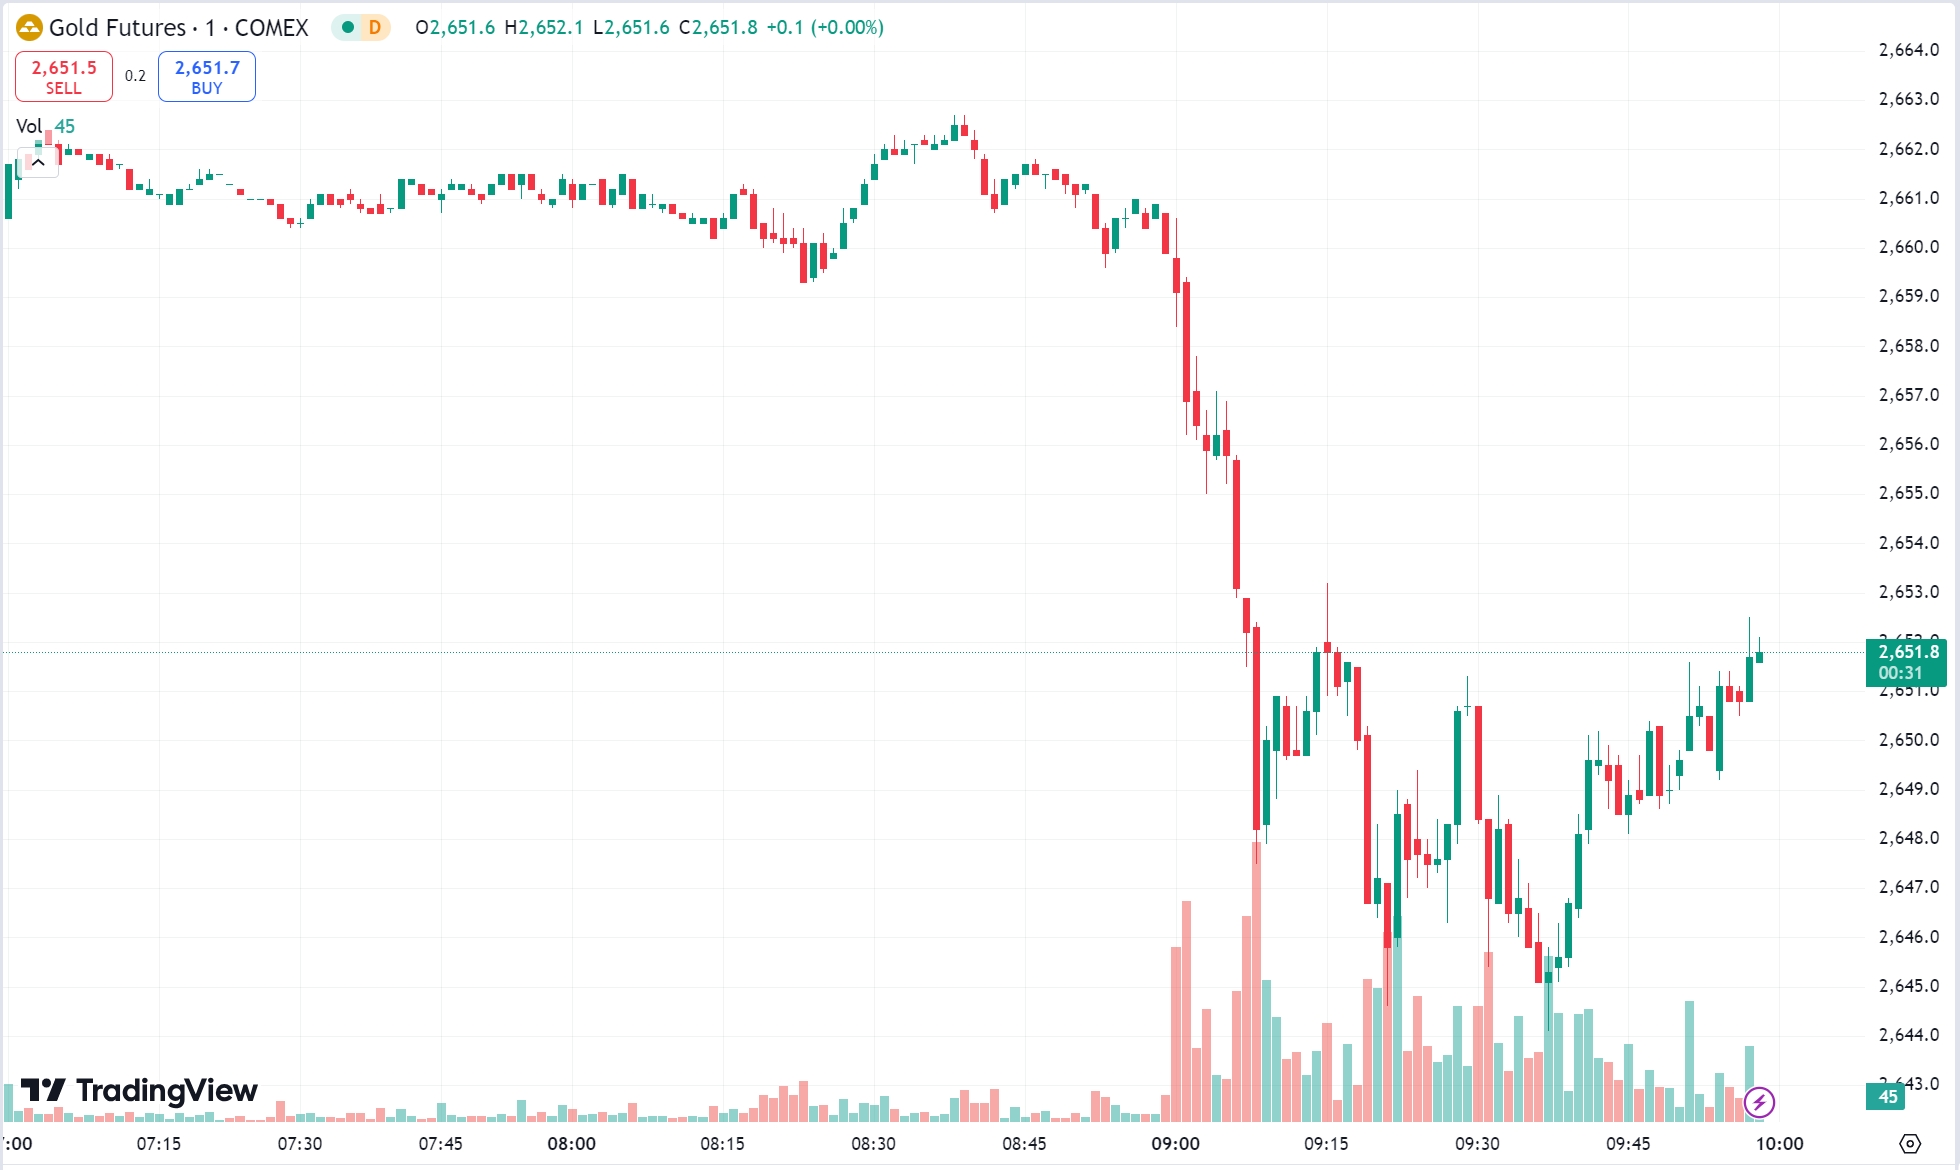
Gold prices were supported by a weaker US dollar, reaching $2,658 during the day, but retreated after the release of PCE data, which showed no significant progress in inflation and suggested the Fed might hold back on additional rate cuts. As a result, gold lost most of its early gains and closed up by 0.30% at $2,635.79 per ounce.
The dollar weakened by around 0.9%, hitting its lowest point in two weeks and retreating about 2% from last Friday’s two-year high, enhancing gold’s appeal to holders of other currencies. US Treasury yields also declined, which supported gold as the opportunity cost of holding the metal decreased.
Amo Sahota, Executive Director at Klarity FX in San Francisco, commented, “Wednesday’s movement may have been more about profit-taking, particularly ahead of the long US weekend.” Sheryl Dong, a foreign exchange strategist at Barclays, noted that the recent strength of the dollar had significantly reduced the value of dollar assets outside the US, thus increasing the demand for rebalancing sales of the dollar at the end of the month.
In terms of economic data, the US reported mixed results. Q3 GDP growth remained steady at 2.8%, driven by cooling inflation and strong consumer spending. However, while initial jobless claims remained low, continuing claims reached their highest level since November 2021, indicating a slight cooling in the labor market.
The PCE inflation data revealed a 2.8% annual increase in core PCE inflation for October, marking the highest level since April. Following the PCE release, gold prices briefly dropped, wiping out most of the day’s gains. According to the FedWatch tool, the market currently estimates a 66.5% probability of a 25-basis-point rate cut by the Fed in December.
With the US Thanksgiving holiday this week, historical trends suggest that gold prices may remain relatively stable, but investors should stay alert to geopolitical developments and any news regarding Trump-related policies, as these could lead to potential market fluctuations.
Gold Technical Analysis:
On the technical front, gold experienced a sharp rise and fall during the day, peaking at $2,658 before retreating. By the close, it settled below $2,640, forming a Doji candlestick pattern. The price is showing signs of resistance above $2,655, suggesting a potential continuation of the downtrend if the price retraces to the $2,645-$2,648 range. Short-term support remains at the $2,600 level.

Today’s Focus:
- For today, the recommended strategy is to consider short positions on gold on rebounds, with long positions for pullbacks.
- Resistance: 2653-2658
- Support: 2620-2615
Oil
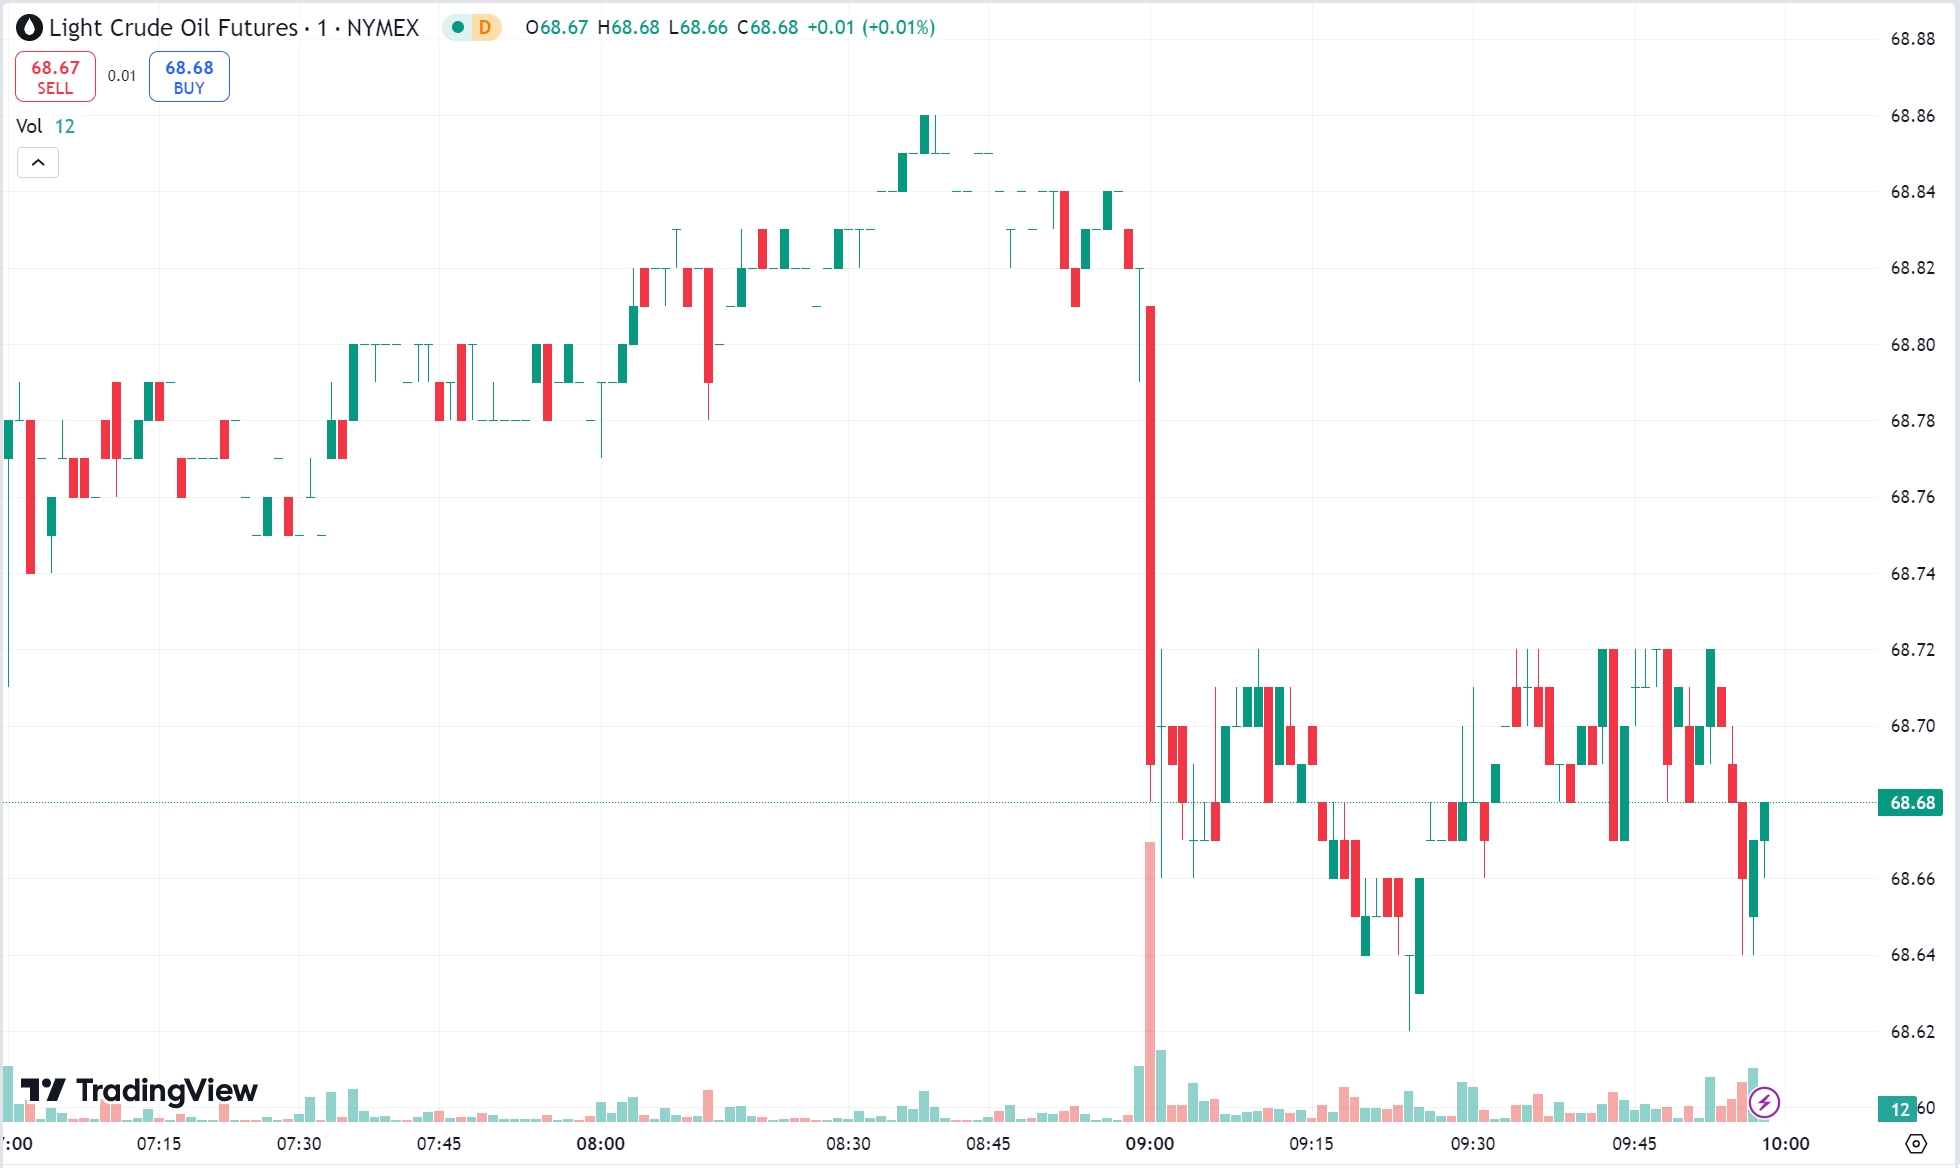
Oil prices experienced a modest decline on Wednesday as the market evaluated the Israel-Lebanon ceasefire, a lower-than-expected increase in US crude inventories, and the upcoming OPEC+ meeting on Sunday. WTI January crude futures closed at $68.72 per barrel, down by $0.05 (0.07%), while Brent January futures ended virtually unchanged at $72.83 per barrel.
After Israel agreed to a ceasefire with Hezbollah, brokered by the US and France, tensions in the Middle East eased, leading to a reduction in geopolitical risk premiums. Dennis Kissler, Senior Vice President of Trading at BOK Financial, cautioned that the “real question is how long the ceasefire will hold.”
Market attention is now turning toward the OPEC+ meeting scheduled for December 1. Sources have indicated that OPEC, which controls nearly half of the world’s oil supply, may delay its planned January production increase and maintain its current cuts of 2.2 million barrels per day. This could provide support for prices through early 2025.
Jeff Currie, Chief Strategist at Carlyle Group, noted that oil prices are “attempting to price in a future oversupply” and that the recent price pullback has diminished the likelihood of a supply glut materializing.
Additionally, the US Energy Information Administration (EIA) reported a 1.844 million barrel drop in crude inventories last week, although gasoline inventories increased by 3.3 million barrels, which pressured market sentiment.
Oil Technical Analysis:
Oil prices were range-bound below $69.5, with a slight decline toward the $68 level during US trading hours. The market formed a Doji candlestick on the daily chart, showing signs of consolidation beneath the $70 level. The price remains weak with resistance at $70 and support at $67.5-$67.0.

Today’s Focus:
- The recommended strategy is to focus on selling oil on upward corrections, with buying opportunities for pullbacks.
- Resistance: 70.0-70.5
- Support: 67.5-67.0
Risk Disclosure
Securities, Futures, CFDs and other financial products involve high risks due to the fluctuation in the value and prices of the underlying financial instruments. Due to the adverse and unpredictable market movements, large losses exceeding your initial investment could incur within a short period of time.
Please make sure you fully understand the risks of trading with the respective financial instrument before engaging in any transactions with us. You should seek independent professional advice if you do not understand the risks explained herein.
Disclaimer
This information contained in this blog is for general reference only and is not intended as investment advice, a recommendation, an offer, or an invitation to buy or sell any financial instruments. It does not consider any specific recipient’s investment objectives or financial situation. Past performance references are not reliable indicators of future performance. Doo Prime and its affiliates make no representations or warranties about the accuracy or completeness of this information and accept no liability for any losses or damages resulting from its use or from any investments made based on it.
The above strategies reflect only the analysts’ opinions and are for reference only. They should not be used or considered as the basis for any trading decisions or as an invitation to engage in any transaction. Doo Prime does not guarantee the accuracy or completeness of this report and assumes no responsibility for any losses resulting from the use of this report. Do not rely on this report to replace your independent judgment. The market is risky, and investments should be made with caution.


